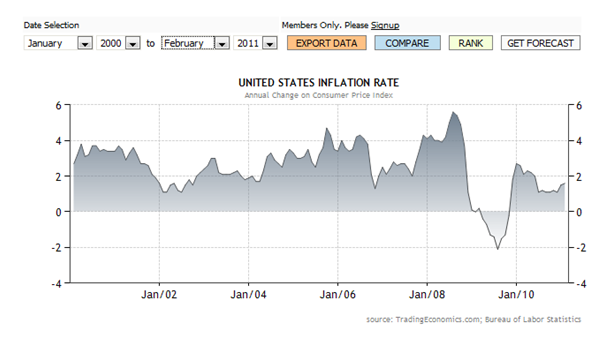
The above chart tracks the United States’ inflation rate since January of 2000 through February of 2011 taking monthly averages. The deflation experienced between 2009 and January of 2010 is believed by many to be explained by the Phillips Curve, which “represents the relationship between the rate of inflation and the unemployment rate” (Source A).
But what exactly is inflation?
According to Investopedia, inflation is the rate at which general level of prices for goods and services is rising and purchasing power is falling. Central banks attempt to stop severe inflation as well as severe deflation in an attempt to keep the excessive growth of prices to a minimum (Source B).
So, as you can tell by the chart, it looks like the inflation rate is relatively low with respect to 2006-2008 levels. With rising prices and an increasing need for consumers to cut back at home or search for substitutes, many are clamoring for lower prices. There are several different economic policies a government can enact to reduce inflation:
- Monetary Policy – Increase interest rates.
- Raises the costs of borrowing which leads to reduced spending.
- Increased interest rates makes saving a more appealing prospect.
- Supply Side Policies – Privatization and deregulation.
- Make firms more competitive and more productive to keep costs low.
- Works in the long run and won’t necessarily bring prices down today.
- Fiscal Policy – Tax policies.
- Increasing taxes and reducing government spending will reduce aggregate demand.
Naturally, there are many other policy options to be considered as everything seems almost inextricably linked in economics, but these will do for our purposes.
But what if the U.S. government decided to simply reduce the value of our money by 20% overnight? To put this in perspective, imagine that your $1 bills were now worth 80¢, your $5s worth $4, your $20s a mere $16 and so on and so forth. Well, this is essentially what happened in 18th century France.
Granted, the monetary regime in place at the time is not the same as ours today. In 1726 France, when these events took place, the government was using a variety of gold and silver coins which didn’t indicate a specific value, like our alternate fiat money. The intent behind the French government’s actions was to lower general price levels, which they thought were too high.
What the government didn’t anticipate, however, were the adverse effects it would have due to expectations. Once the value of their specie dropped, the people lost faith in the coins and held their wares as collateral against the expectation of further diminution. Goods were worth more than the money if there were further decreases in the value of the coins. Business owners had stocked up their inventory based off of yesterday’s prices, so selling them without increasing prices would, in fact, be counterproductive and harmful to their own well-beings.
A local official in Marseille described the situation from a more personal perspective, “the diminution has suspended all business and increased the prices of foodstuffs and merchandise. We never doubted that the first diminution would have this effect…all sensible people are convinced that the third diminution will begin to have some effect and progressively things will return into balance with specie, as long as all are convinced of the King’s firm and serious intention not to increase after the diminutions, It is up to the Court to see how it can persuade foreigners and the King’s subjects that this intent is serious, firm, and unwavering.”
This graph essentially describes what took place in France. First, the government reduced the value of the money. Output and commerce suffered significant setbacks and the aggregate demand curve shifted to the left to reach point B for a significantly longer period of time than was expected by the government. This was due to a combination of expectations that the value of the money was going to continue to fall and because of the contracts which hadn’t yet been renegotiated.
To support his proposition that a law be passed reducing all leases passed since January 1720, the mayor of Nantes said, “In vain would one ask merchants to cut the prices of their wares by a third if one does not reduce by a third the leases on their shops.”
Only after the government finally came out and set an official price did France undergo market clearing and the economy reach point C on the long run aggregate supply curve, as indicated by the arrows.
So inflation, it turns out, has a great deal to do with expectations. Business owners might, for example, anticipate that transportation costs are going to increase due to rising oil prices and bring up their prices. Before you know it, all costs and prices might go on the rise, all due to expectations. Something to be careful of, however, is that history shows that prices are much easier to increase than they are to bring down.
Sources:
Source A: http://www.econlib.org/library/Enc/PhillipsCurve.html
Source B: http://www.investopedia.com/terms/i/inflation.asp
Source C: http://www.econtalk.org/archives/2009/02/meltzer_on_infl.html (podcast)
Source D: Chart Source http://www.tradingeconomics.com/economics/inflation-cpi.aspx?Symbol=USD
Source E: http://www.frbsf.org/publications/economics/letter/2009/el2009-12.html – philips curve
Source F: Policy http://www.economicshelp.org/blog/inflation/economic-policies-to-reduce-inflation/

